How to get synthetics monitoring to work in New Relic?
Do you want to see the global overview of your application from outside? Synthetic monitoring can help you to view customers’ points of view about your application. You can observe how your application and system are performed for the user experience with the help of the New Relic feature in synthetics monitoring.
Moreover, you can check the performance and availability of your web applications from every location in the world. This feature helps you to identify errors and issues and ensure that your application works smoothly with a great user experience.
Not just one, with the help of synthetics monitoring, new relics also provide a range of featured skills. By using these features you can optimize and monitor the infrastructure of your web application, including new relic features:
- Error and Issues Tracking
- Performance Monitoring of Application
- Infrastructure Monitoring
With the help of these above tools, you can check the behavior and deep visibility of your web page. You can also optimize performance, troubleshooting, and bottleneck with synthetics monitoring new relics.
So now in this blog post, we will go through the most requested question “How to get synthetics monitoring to work in New Relic?” but before we dive into the answer to this question, let’s talk about some theories first:
What is Synthetic Monitoring?
Synthetic Monitoring is a tool that helps to monitor the process of web pages and system services before any failure expectation. We can say that it is a pre-prediction and alerting tool for web applications.
Moreover, you can use it as a centralized service for monitoring the performance of low-level errors. Additionally, Synthetic Monitors take care of your application health and also the application data to the servers for identifying coming spikes. These servers trigger the alert for the owner of the web application when something is wrong. These alerts include spikes in login or signup pages, users continually get errors during sign-up for the application. Therefore, we will go through later how to get synthetics monitoring to work in a new relic.
Benefits of Synthetic Monitoring
|
|---|
What is New Relic?
New Relic is an analytical cloud-based software and an optimizer of business performance, IT infrastructure, and software applications. It helps improve digital systems’ health, performance, and availability. Moreover, it is also a real-time detector of application issues and slow performance and delivers a great user experience.
More additionally, New Relic is used all over the world by IT Professionals Developers teams, and operational officers, because it provided wide software ranges, including multiple programming languages, platforms, and frameworks such as mobile, web applications, and other cloud-based software.
Though, before adding New Relic to the working routine it is essential to know it is often updating its products, so check the first New Relic’s official website to choose the most updated feature for your web application.
Benefits of New Relic
|
|---|
How to get synthetics monitoring to work in a new relic?
After going through the purpose and performance of both software, let’s set up the Synthetic Monitoring in New Relic. Follow the below steps:
Create and New Relic Account:
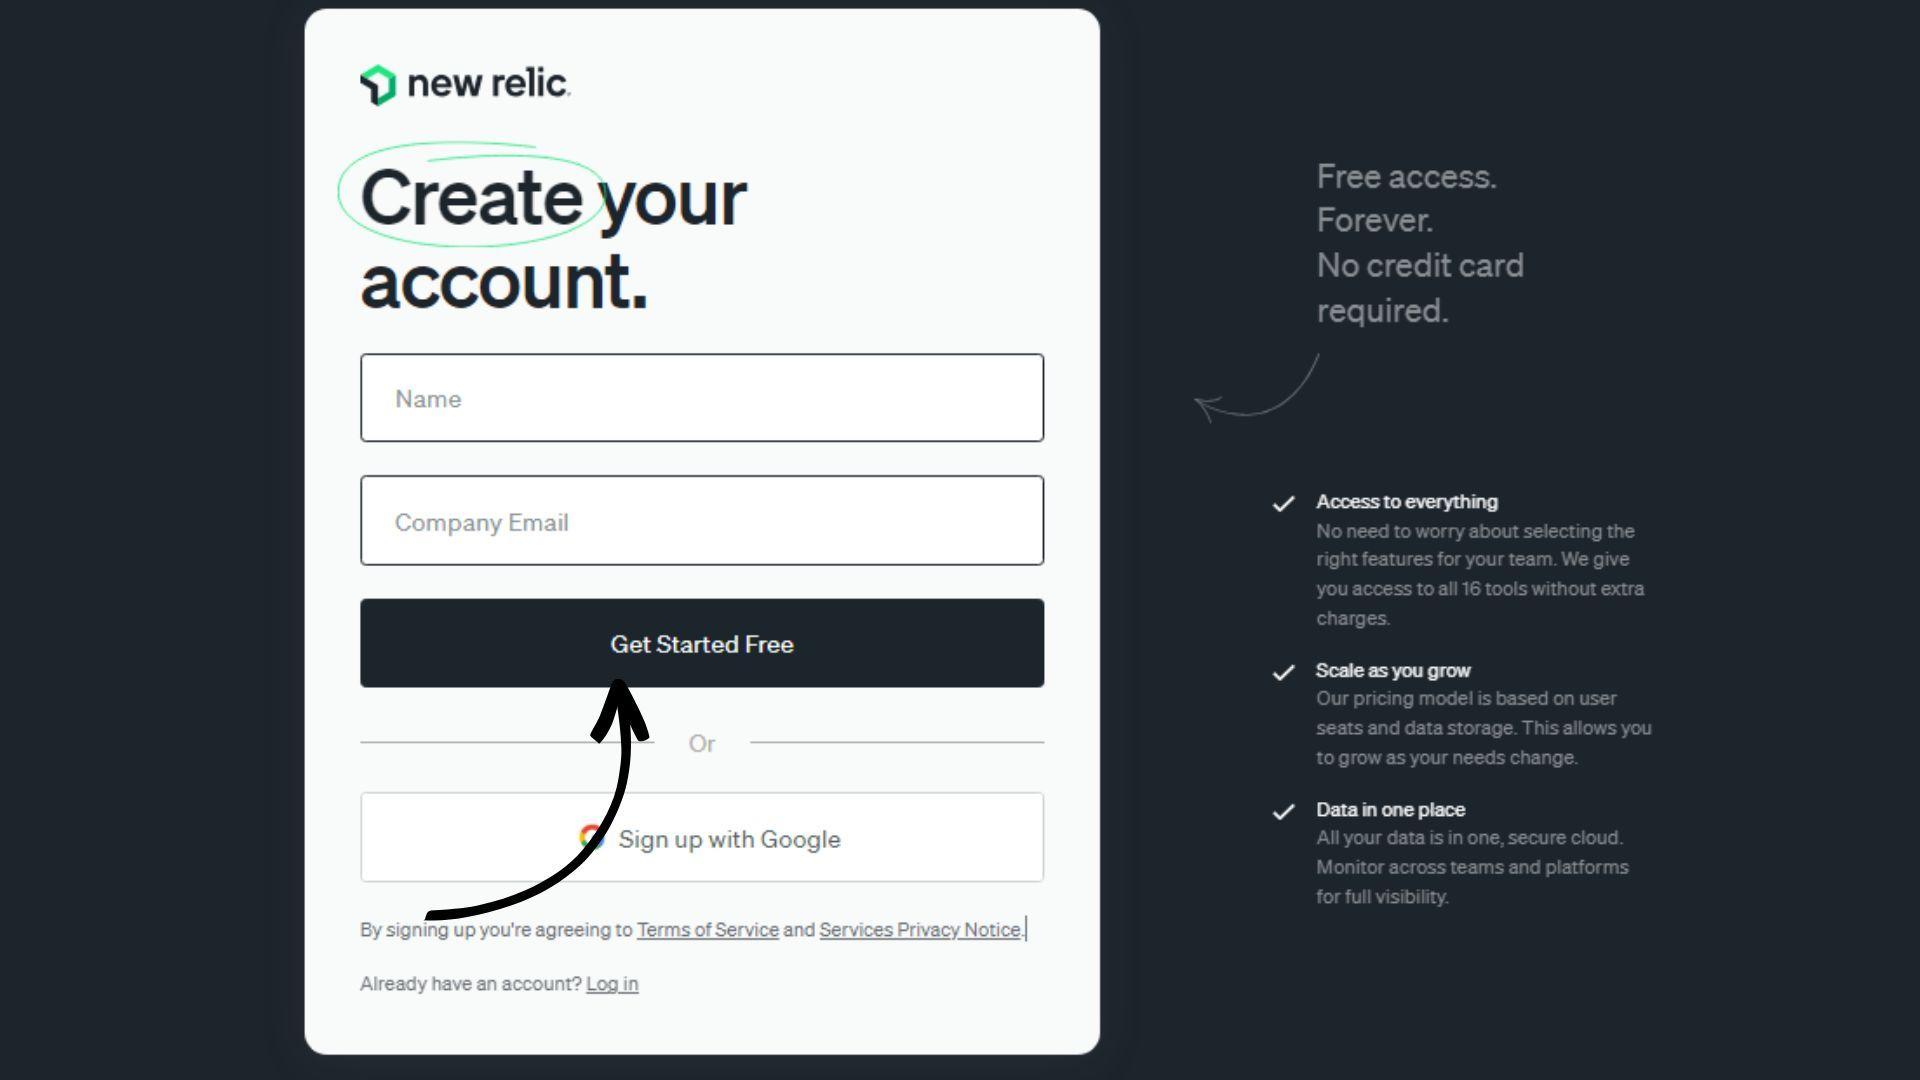
You need to create a New Relic account before getting the functionality of Synthetic Monitoring with New Relic.
-
- Go to the official website (www.nerelic.com)
- Click on the Get Started for Free button
- Enter your Company name and Email
- Click on the Get Started Free Button
- New Relic sends a verification mail
- Go to your entered Email Inbox and click on verify Email Button
- Set the Password and the 3rd step organize the data
- You have to create a New Relic Account successfully
Open Synthetic Section:
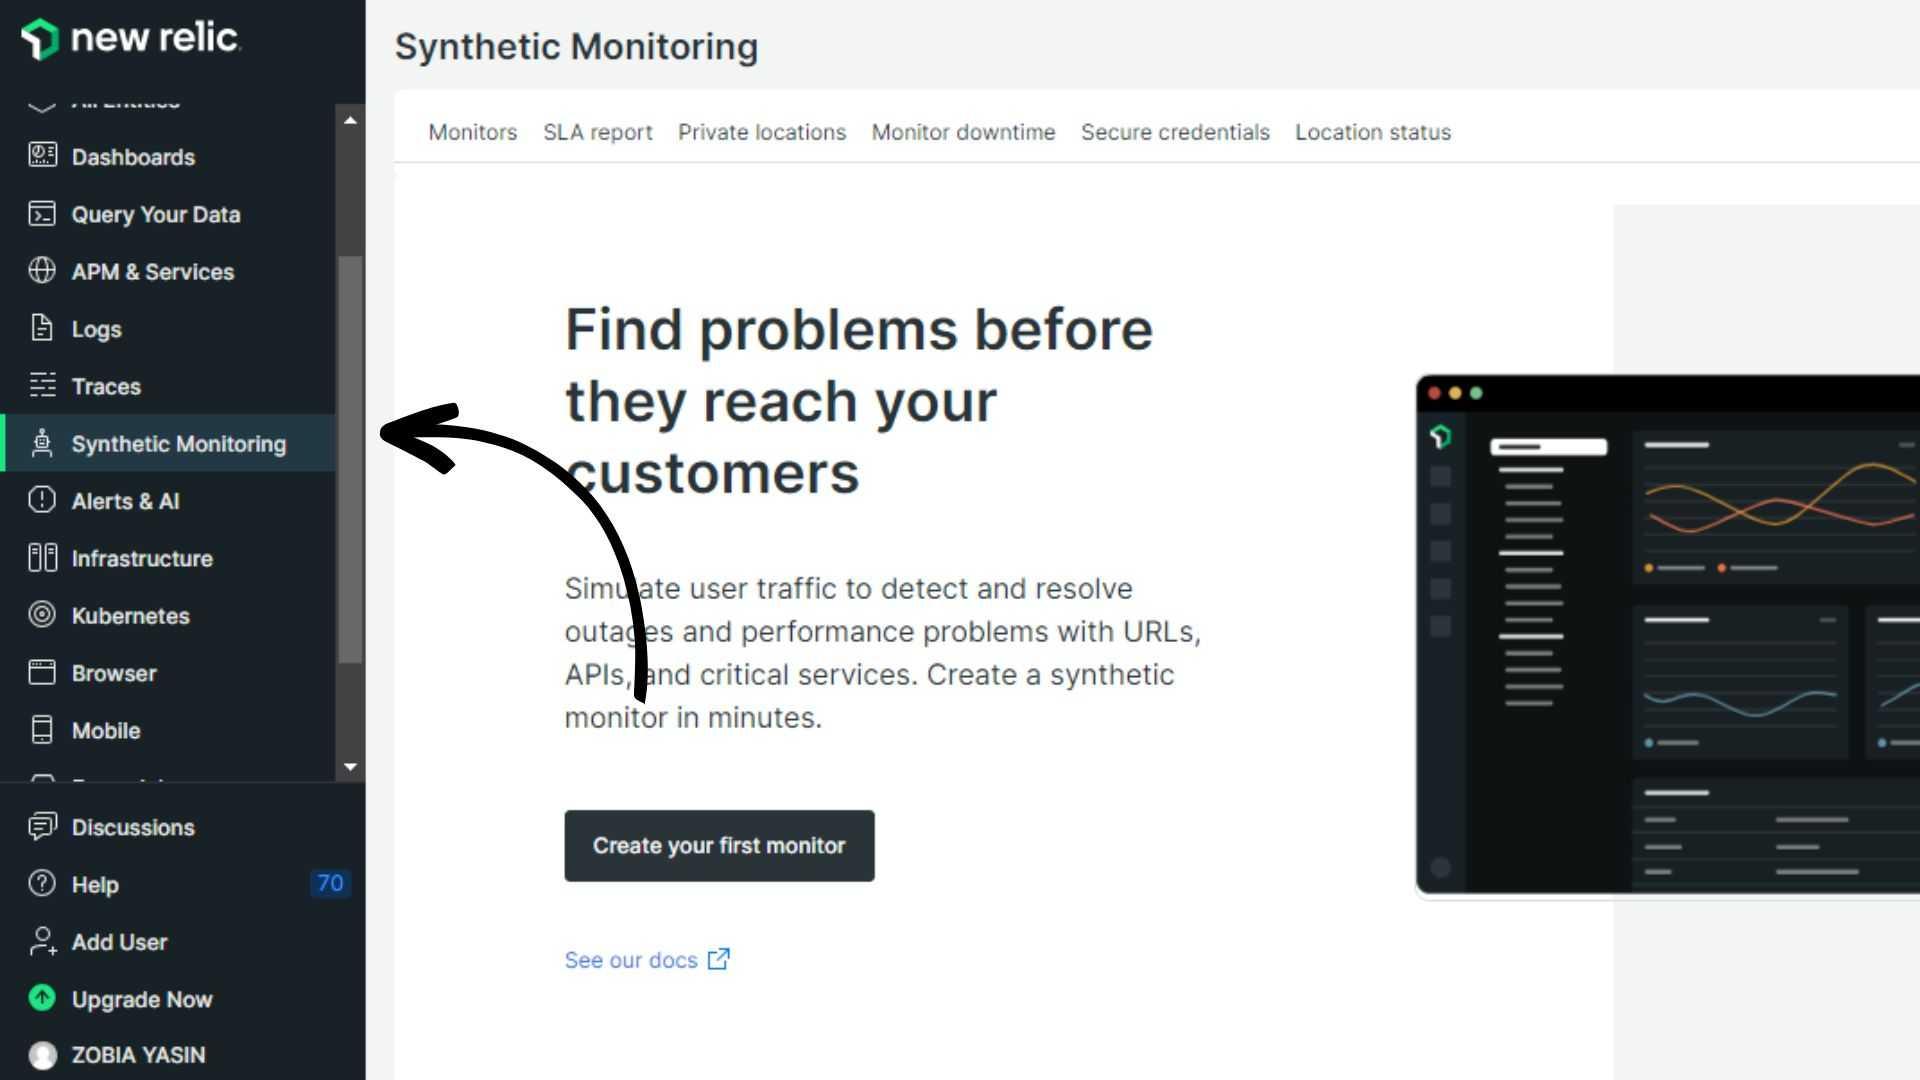
Now once you log in after creating an account:
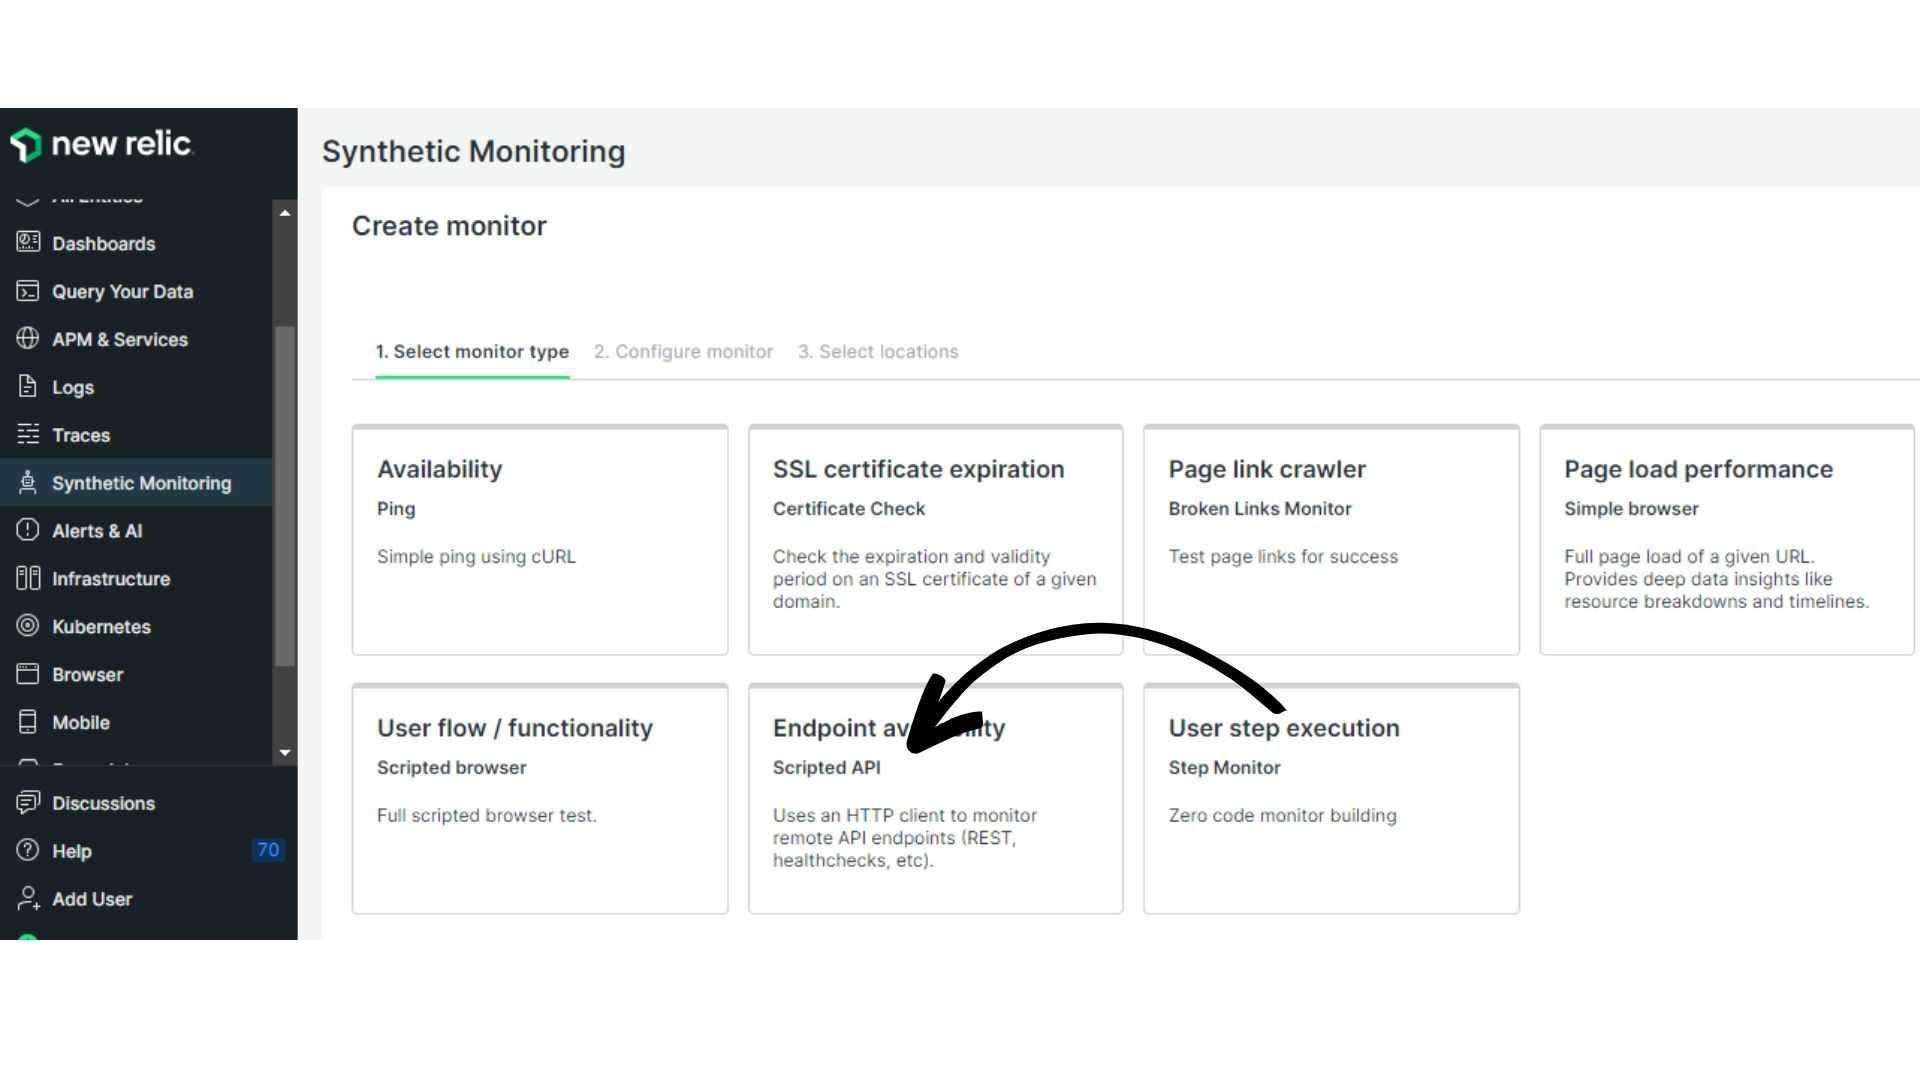
Click on the synthetic monitoring option in the left navigation bar
Select a Monitor Type:
By clicking which type of monitoring you want for your web application. You can choose from availability, endpoint availability, user flow and functionality, SSL certificate expiration, page crawler, and others. After selection click on the save Button. The selection of type is an essential step in How to get synthetics monitoring to work in New Relic?
Configure the Monitor:
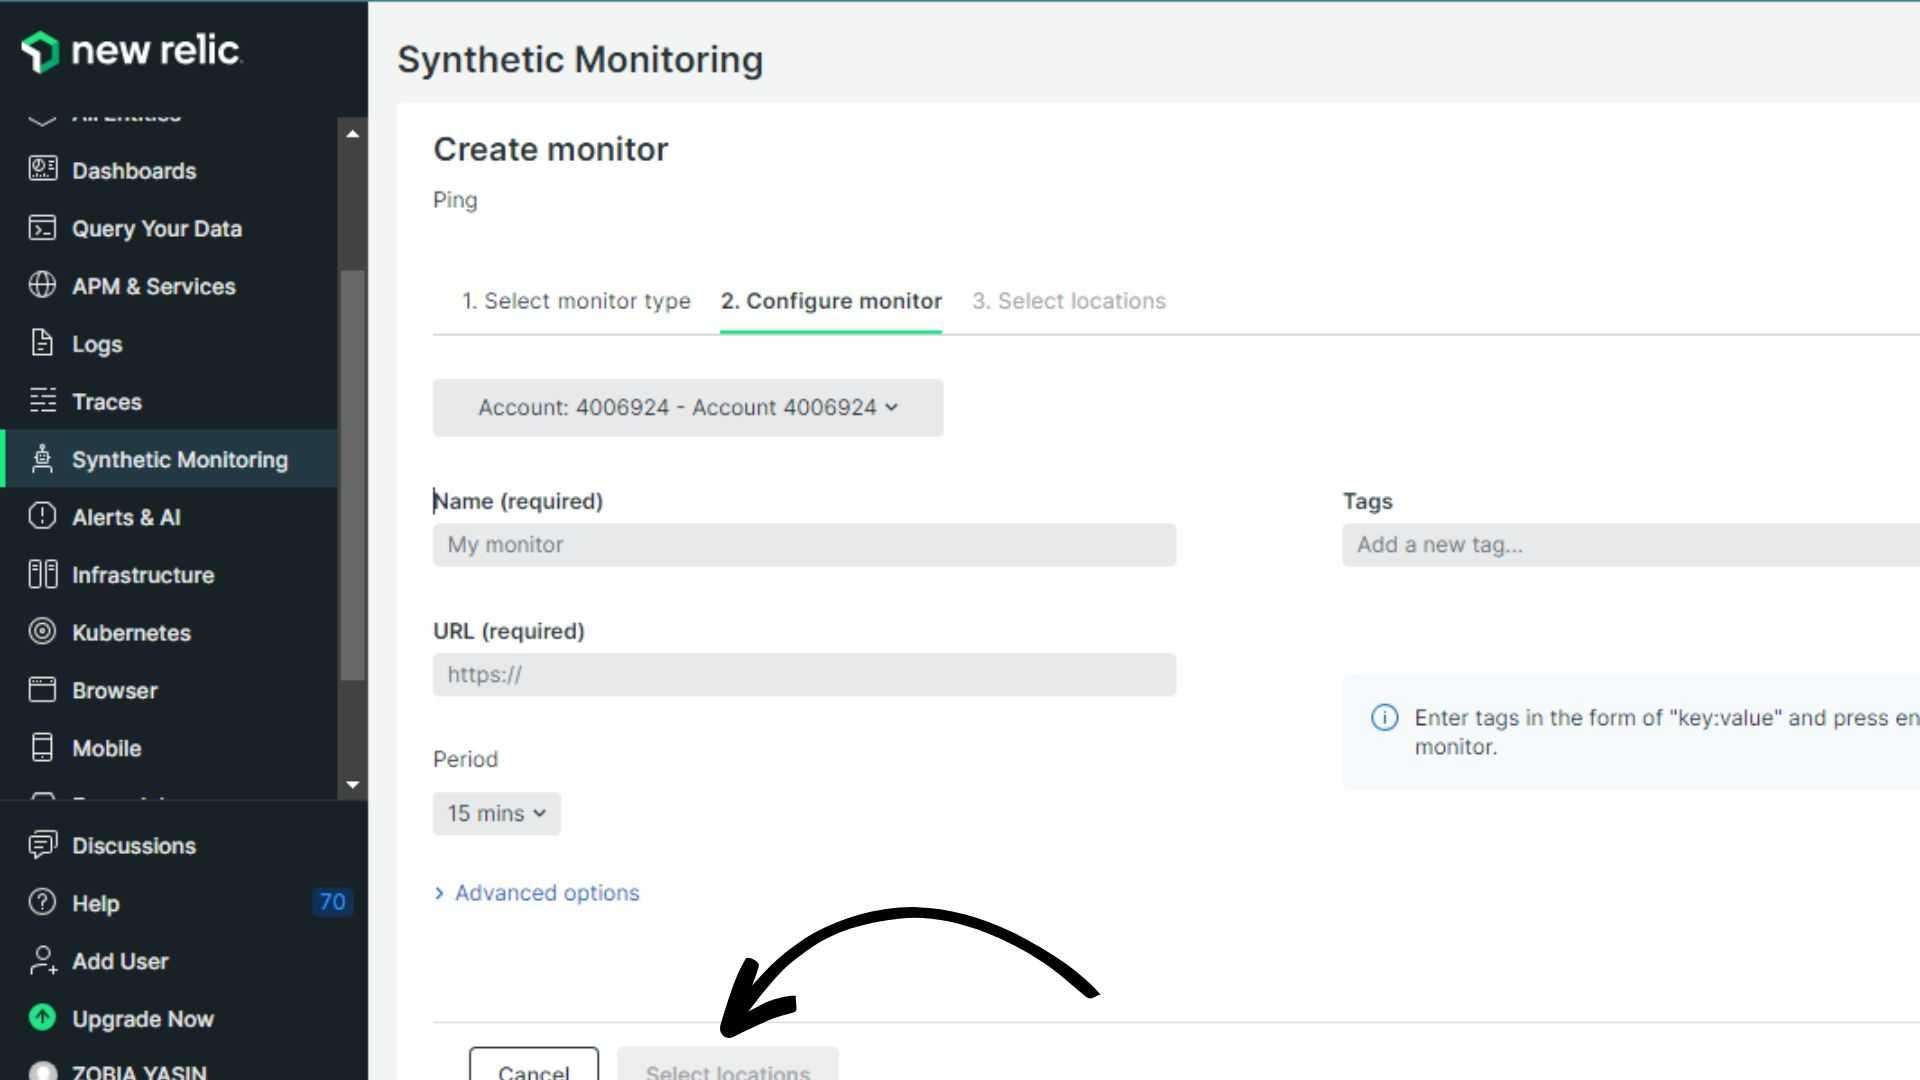
Fill in the required details to configure the monitor. Including Monitor Name, Tags (Optional), URL of your website, and time duration. You can also use the advanced option according to your selection.
Select the Location:
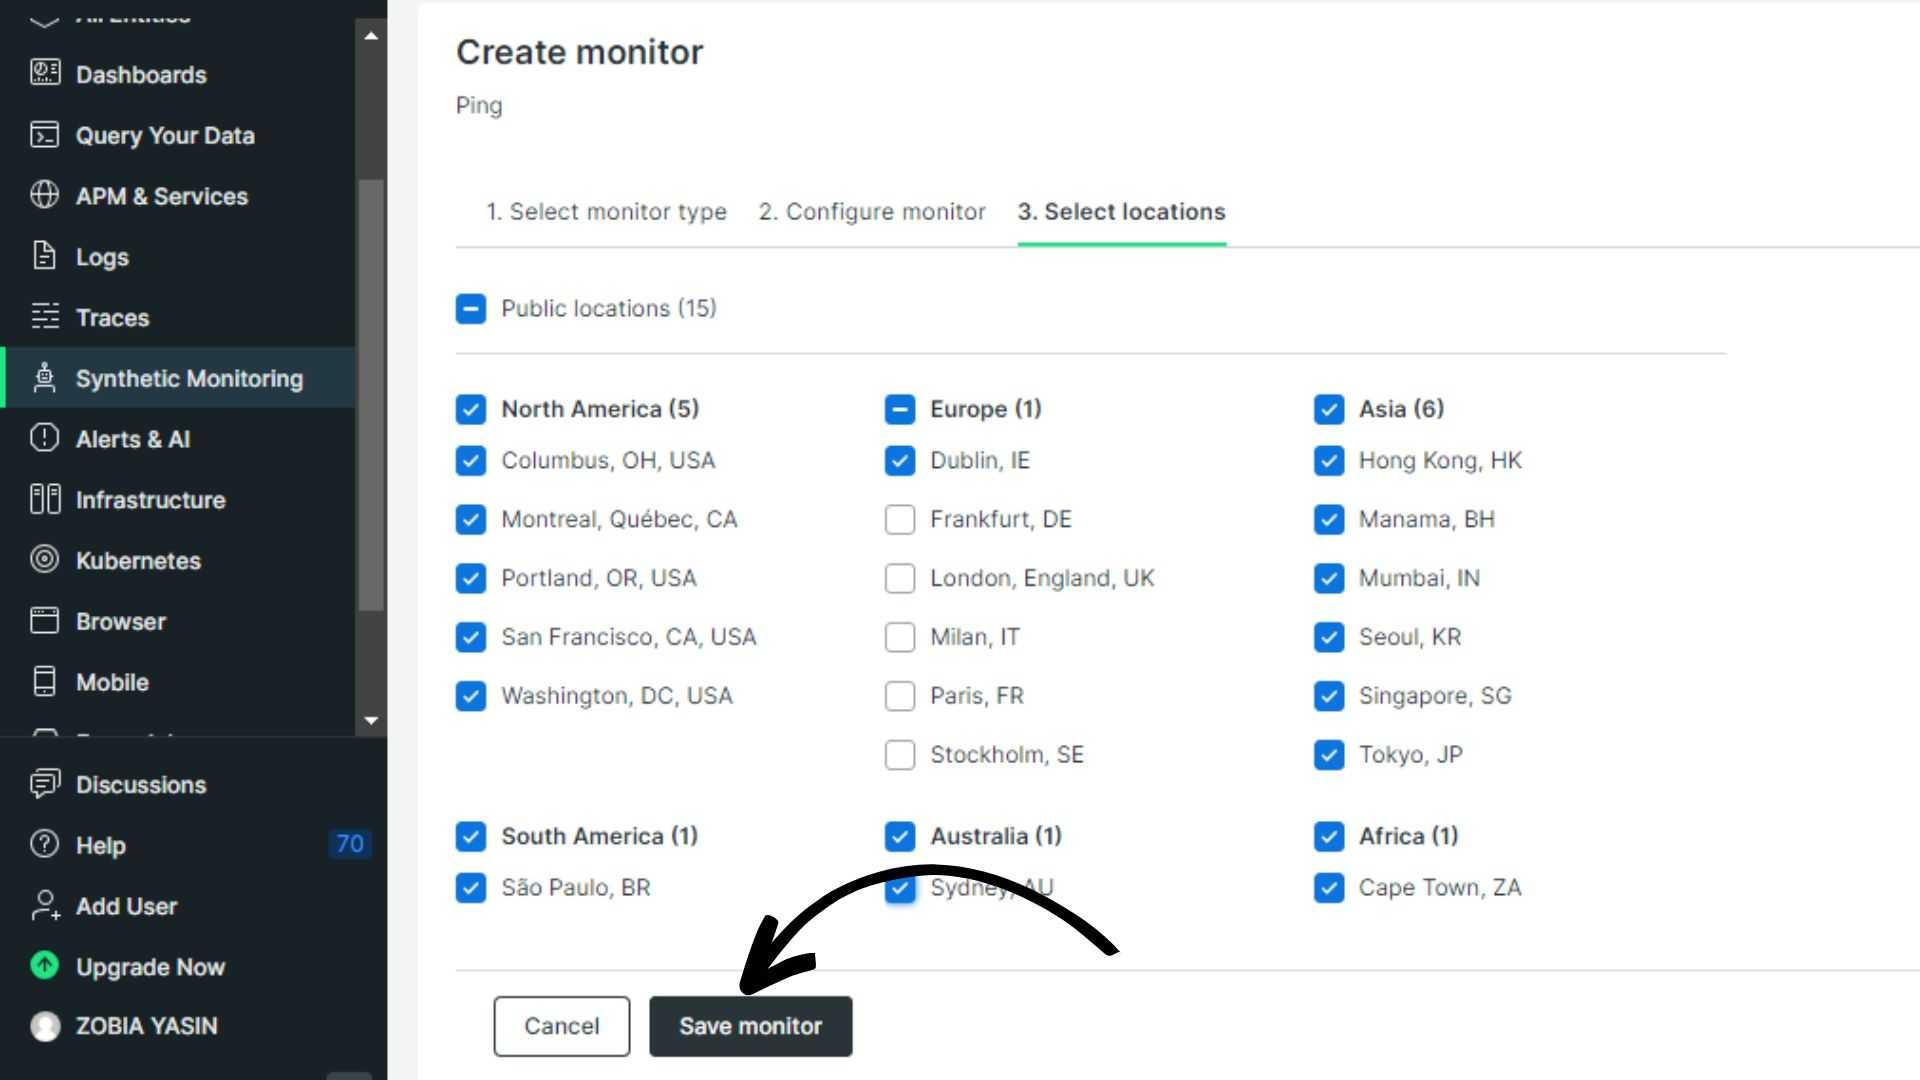
Now you need to select your targeting locations, and which locations customer’s data you want to access. You can choose from the top 15 public locations, including North America, Europe, Asia, South America, Australia, and Africa. Mark the required location and click on the save monitor button.
Open Summary Page:
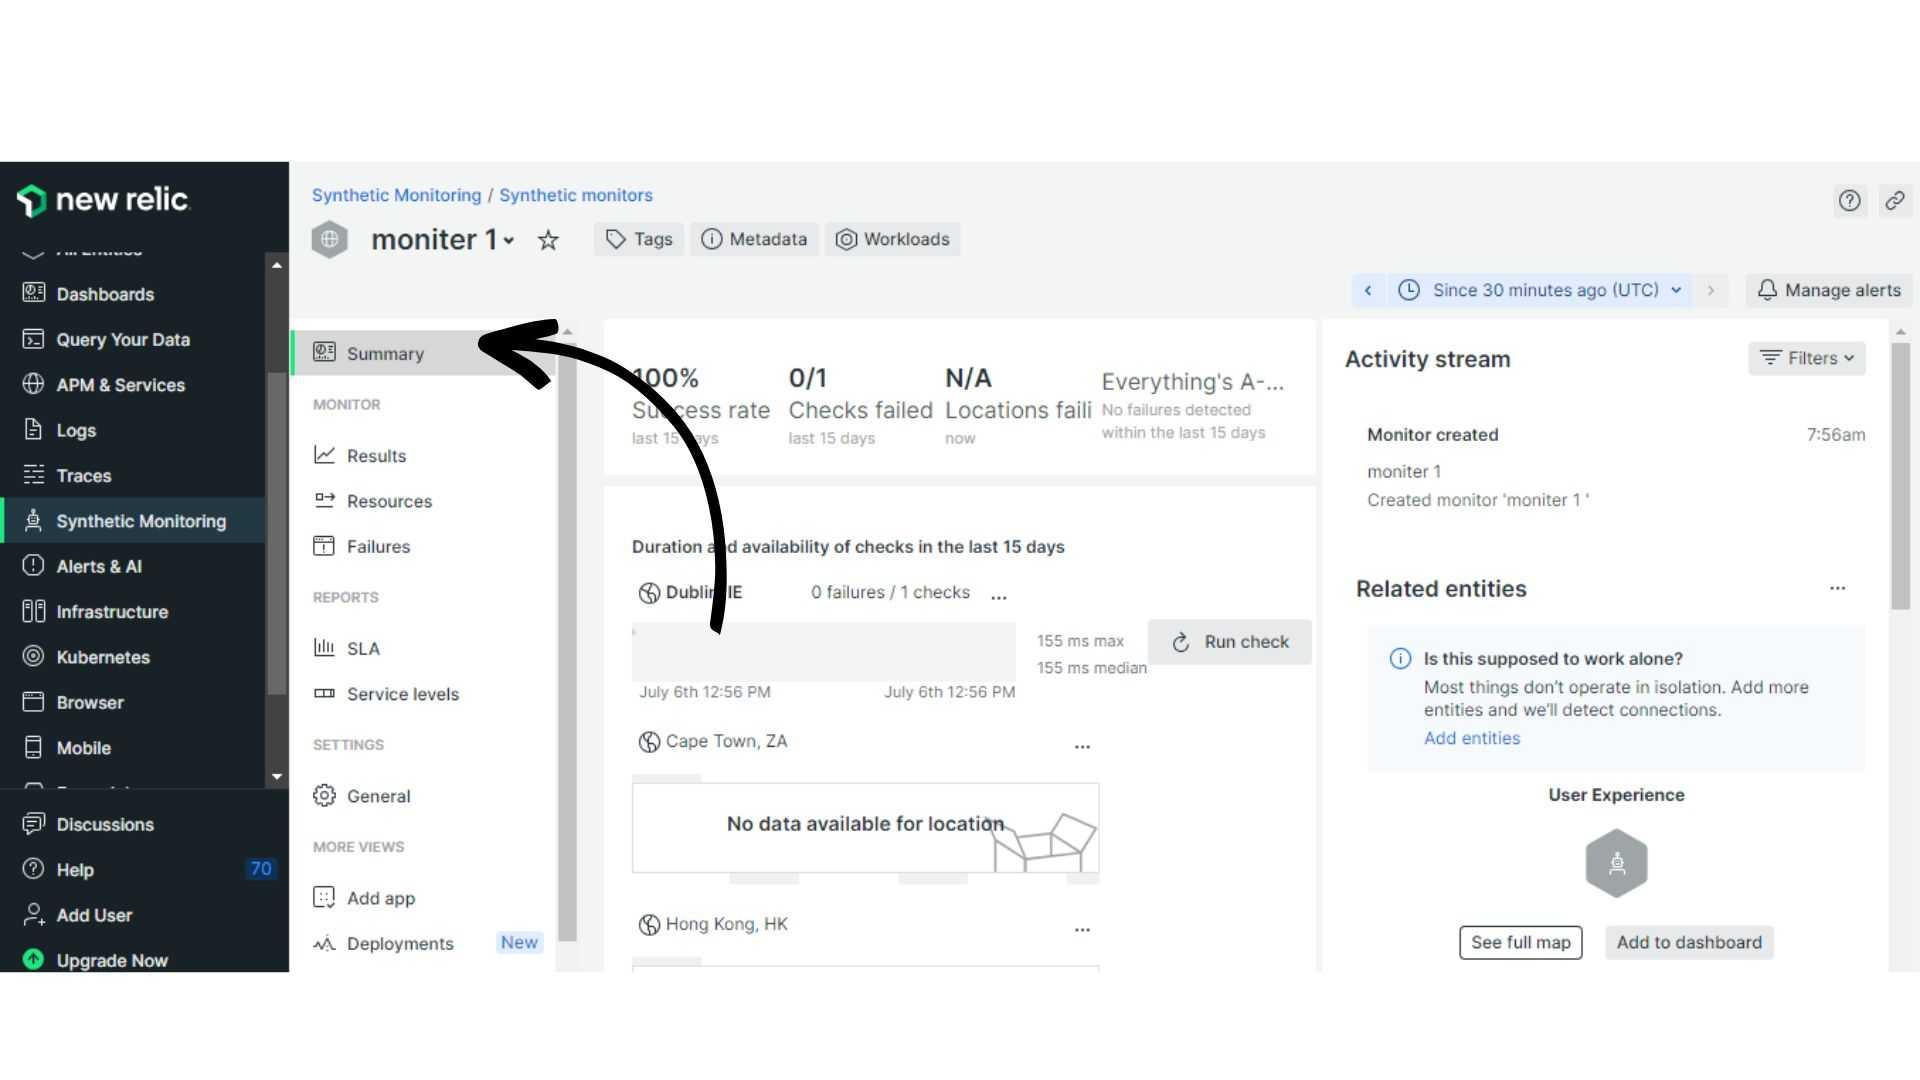
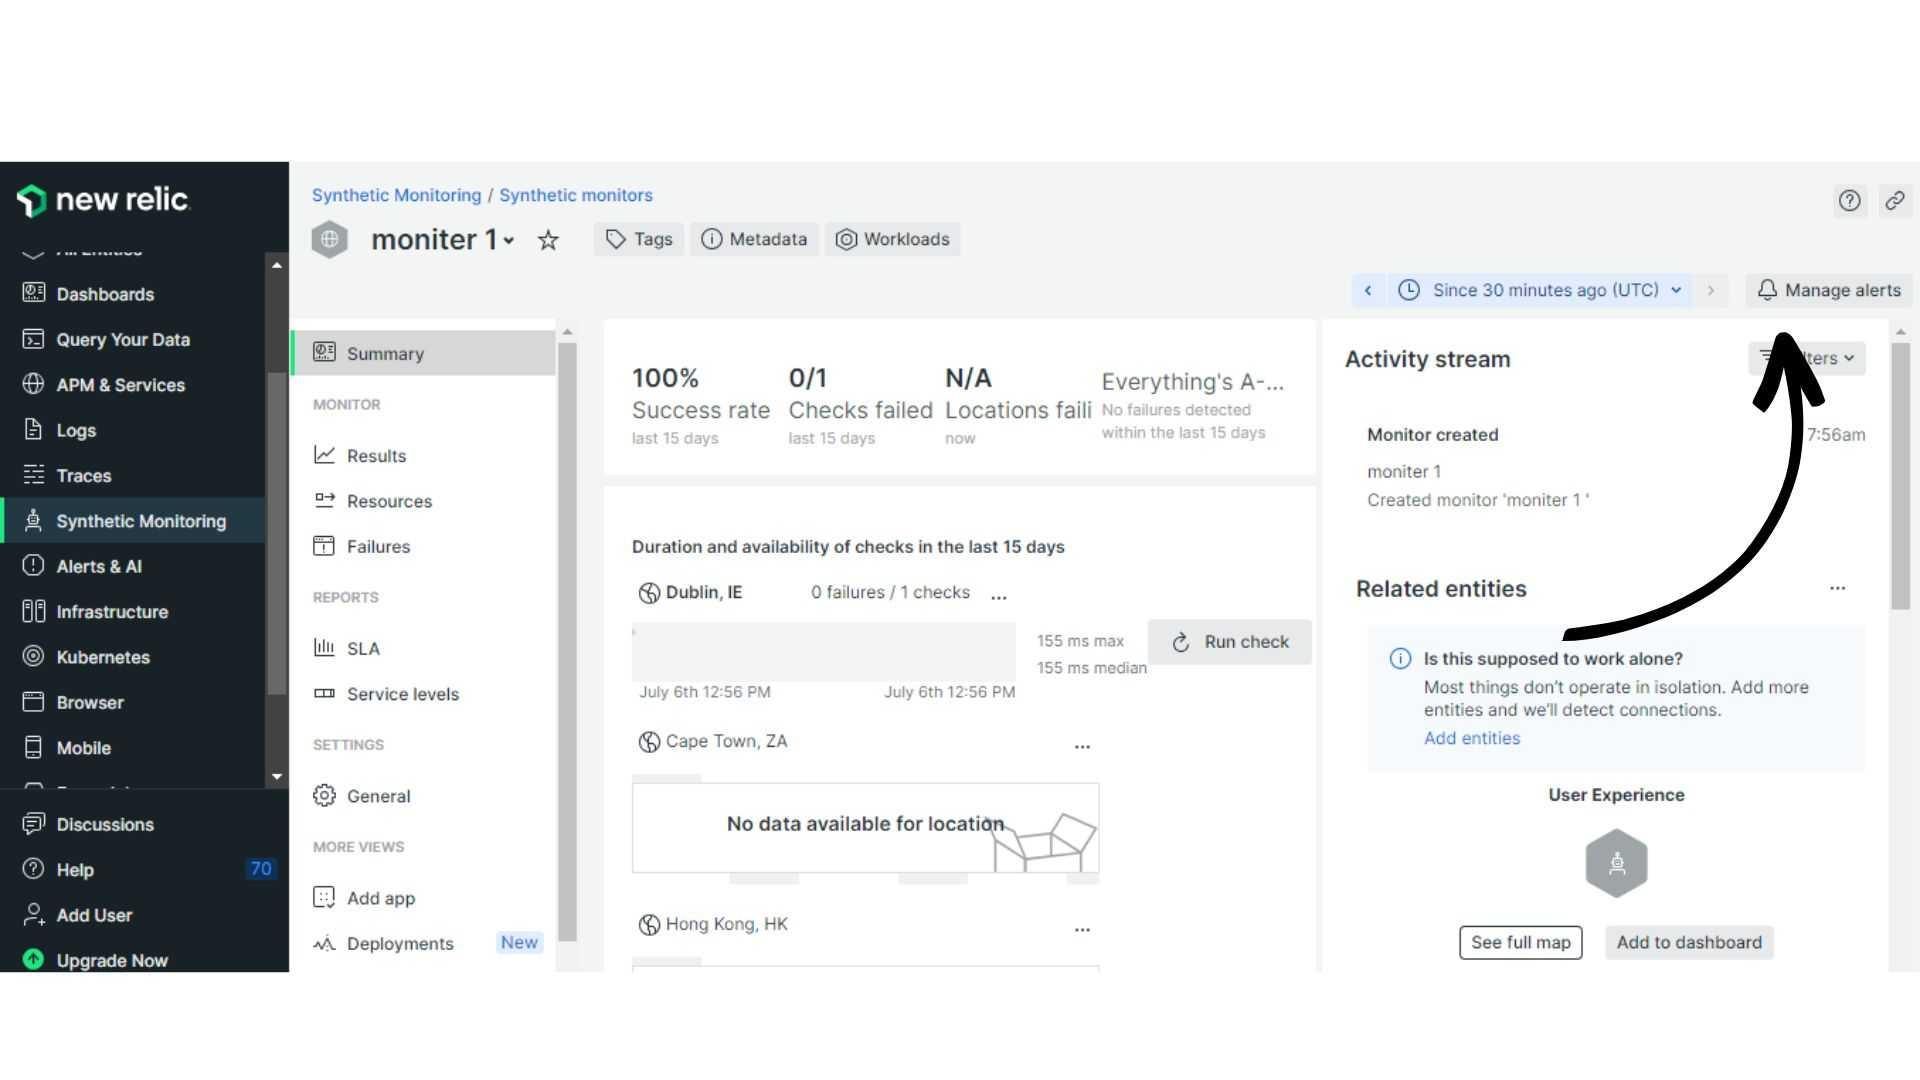
You can check your synthetic monitor status on the summary page. If your web application has any critical alert it will show in the upper right corner of the summary page. Either you can set the alert conditions by clicking on the upper right corner on the manage alerts option or you also click on the left navigation panel with the option “Alerts & AI”.
Manage Alert Conditions:
Define alert conditions that should alert you before any troubleshooting. You need to do, set the Responsive time, specific content check, and availability. So you will receive an alert message from the new relic when its monitor detects an issue in application performance.
Save Settings and Bookmarks Monitor:
After setting the alert conditions and configuring the monitoring click to save your monitor settings. Activate your monitor for web applications and bookmark it for easy access.
Check Result:
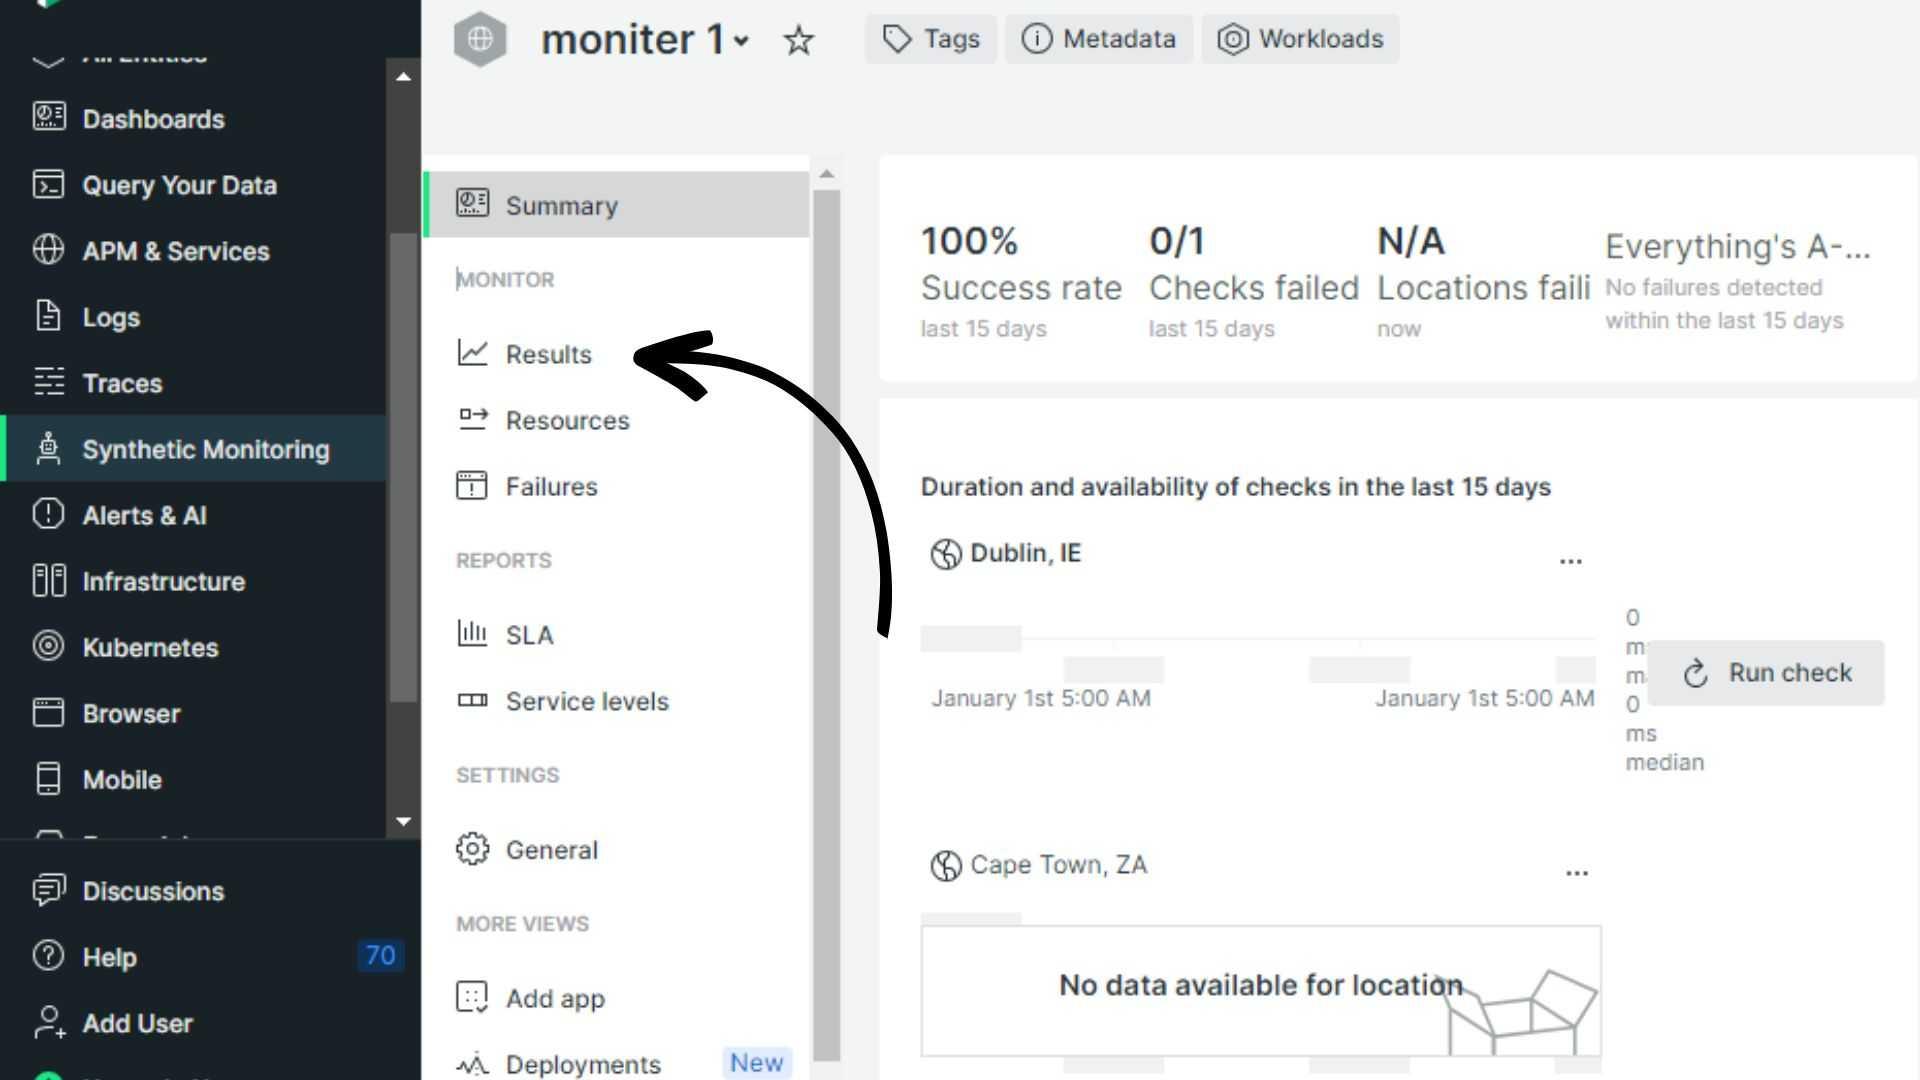
View the performance of the web app Result page in a good way. Try to check the performance after adding location filters. So after activating your account:
- Click again on the synthetic monitor option
- Go to the active monitor
- Click on the result option
The Resources Load-time page:
The resource page gives you a detailed report of your web application and overall load. Including, programming language (HTML, CSS, JavaScript), images, and more. checking the resource page is also the most important step of How to get synthetics monitoring to work in New Relic?
- Click again on the synthetic monitor option
- Go to the active monitor
- Click on the resources option
Hopefully, all the above steps clarify How to get synthetics monitoring to work in New Relic?
Frequently Asked Questions:
How do I monitor the API in New Relic?
You can select a Monitor Type by clicking which type of monitoring you want for your web application.
- Go to the New Relic dashboard.
- Click on the synthetic monitoring.
- Create a new monitor.
- Select the Endpoint availability from the monitoring type.
What is Synthetic monitoring in New Relic?
Synthetic monitoring can help you to view customers’ points of view about your application. You can observe how your application and system are performed for the user experience with the help of the New Relic feature in synthetics monitoring.
How does New Relic monitoring work?
New Relic works as an analytical cloud-based software and an optimizer of business performance, IT infrastructure, and software applications. It helps improve digital systems’ health, performance, and availability. Moreover, it is also a real-time detector of application issues and slow performance and delivers a great user experience.
How does Synthetic monitoring work?
Synthetic Monitors take care of your application health and also the application data to the servers for identifying coming spikes. These servers trigger the alert for the owner of the web application when something is wrong. These alerts include spikes in login or signup pages, users continually get errors during sign-up for the application.
My Opinion
How to get synthetics monitoring to work in New Relic? In my opinion, features and availability might depend on the addition of a new relic, so check the features before you subscribe to the new relic. Moreover, New Relic allows you to monitor your system performance with its provided detailed documentation and supportive content. It also offers a customize and user-friendly interface that you can utilize with Synthetic monitoring efficiently.


